Luxury Hotel Energy Case Study
Nexa Identifies System Inefficiency and Saves Property $40K Per Year on Costs
Context
Working with the Director of Engineering at a 5-star hotel, Nexa was installed at multiple mechanical and guest room locations with temperature and pressure sensors.
The Director of Engineering (DOE) at a 5-star hospitality property asked Nexa to explore the hotel’s energy usage for reporting into their corporate team’s Environment Social Governance (ESG) program. The scope was around the domestic hot water (DHW) system. Nexa installed temperature and pressure sensors around a portion of the property to understand the performance of 3 DHW branch loops that serve the guest rooms. The layout of the plumbing system was twinned (i.e., modeled) in Nexa to map out the relative locations of sensors. Nexa then processed the data and found opportunities for maintenance that saved a significant amount of energy in just 1 of the branch loops.
Data
Nexa sensors were installed to track temperature and pressure at different locations along DHW branch loops and one of the mechanical rooms.
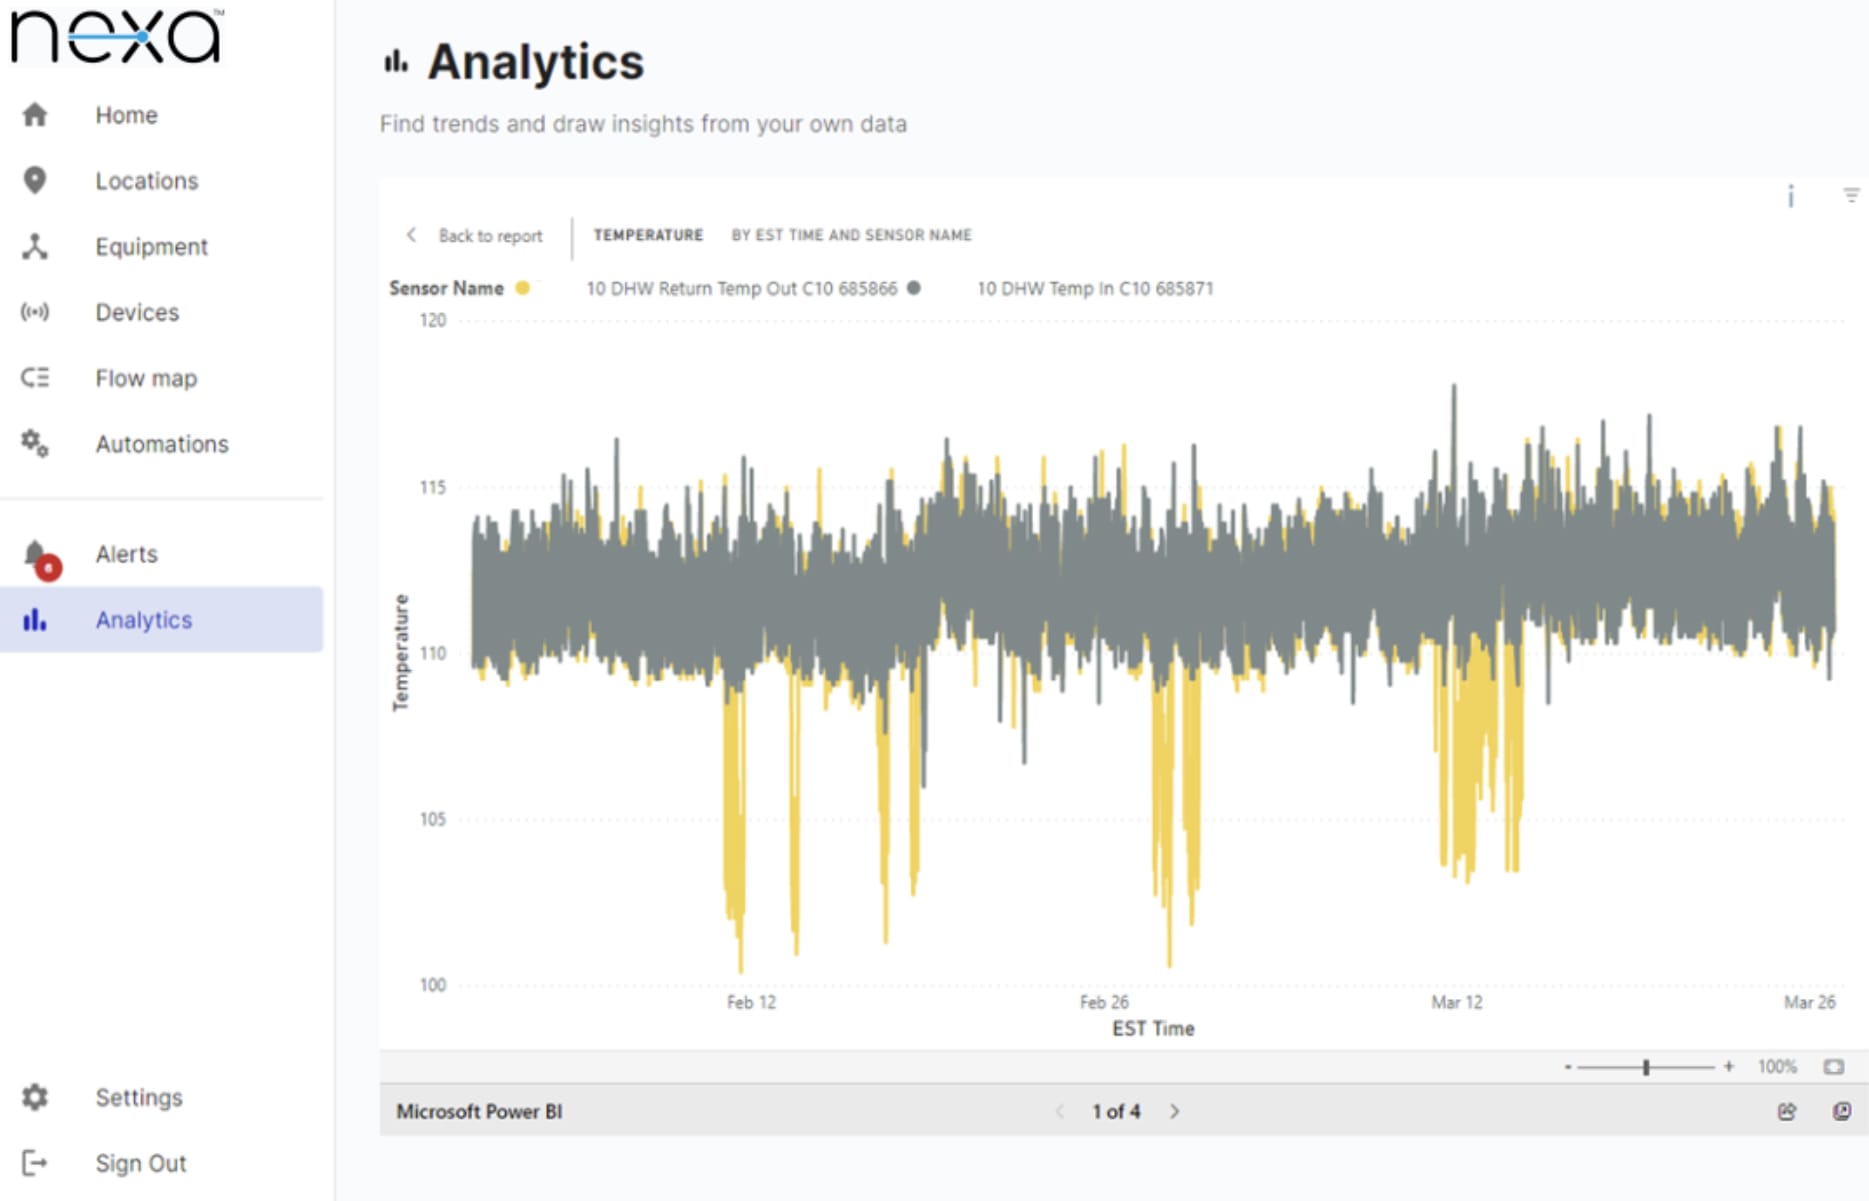
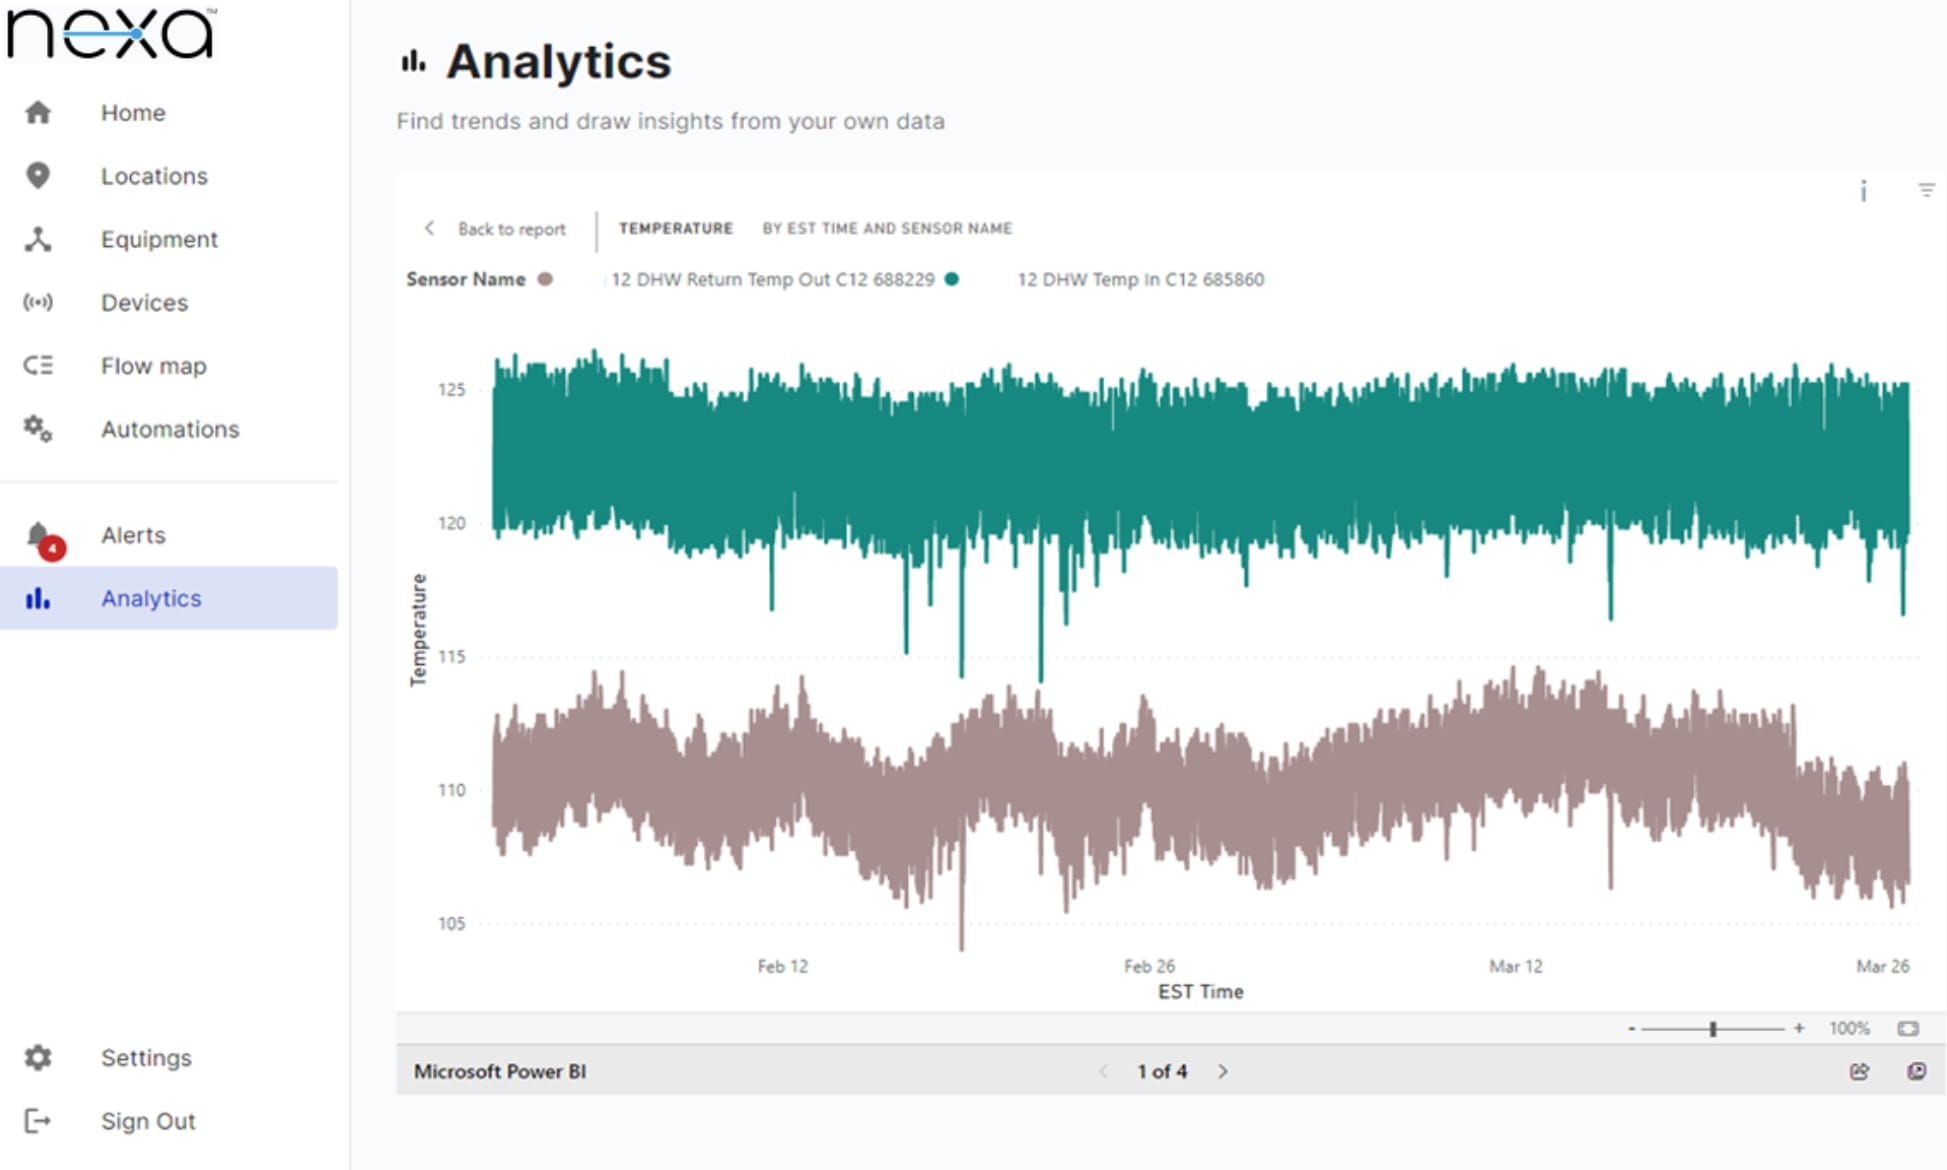
Intent was to explore where the energy loss occurred. Energy loss requires knowing the water flow rate and change in temperature. The temperature was recorded from the sensors placed on the surfaces of supply and return pipes of different branches. PowerBI within Nexa was used to find and plot the branches over the same time period. Branches 10, 11, and 12 were noteworthy given the large differences in both dTemp across the branch.
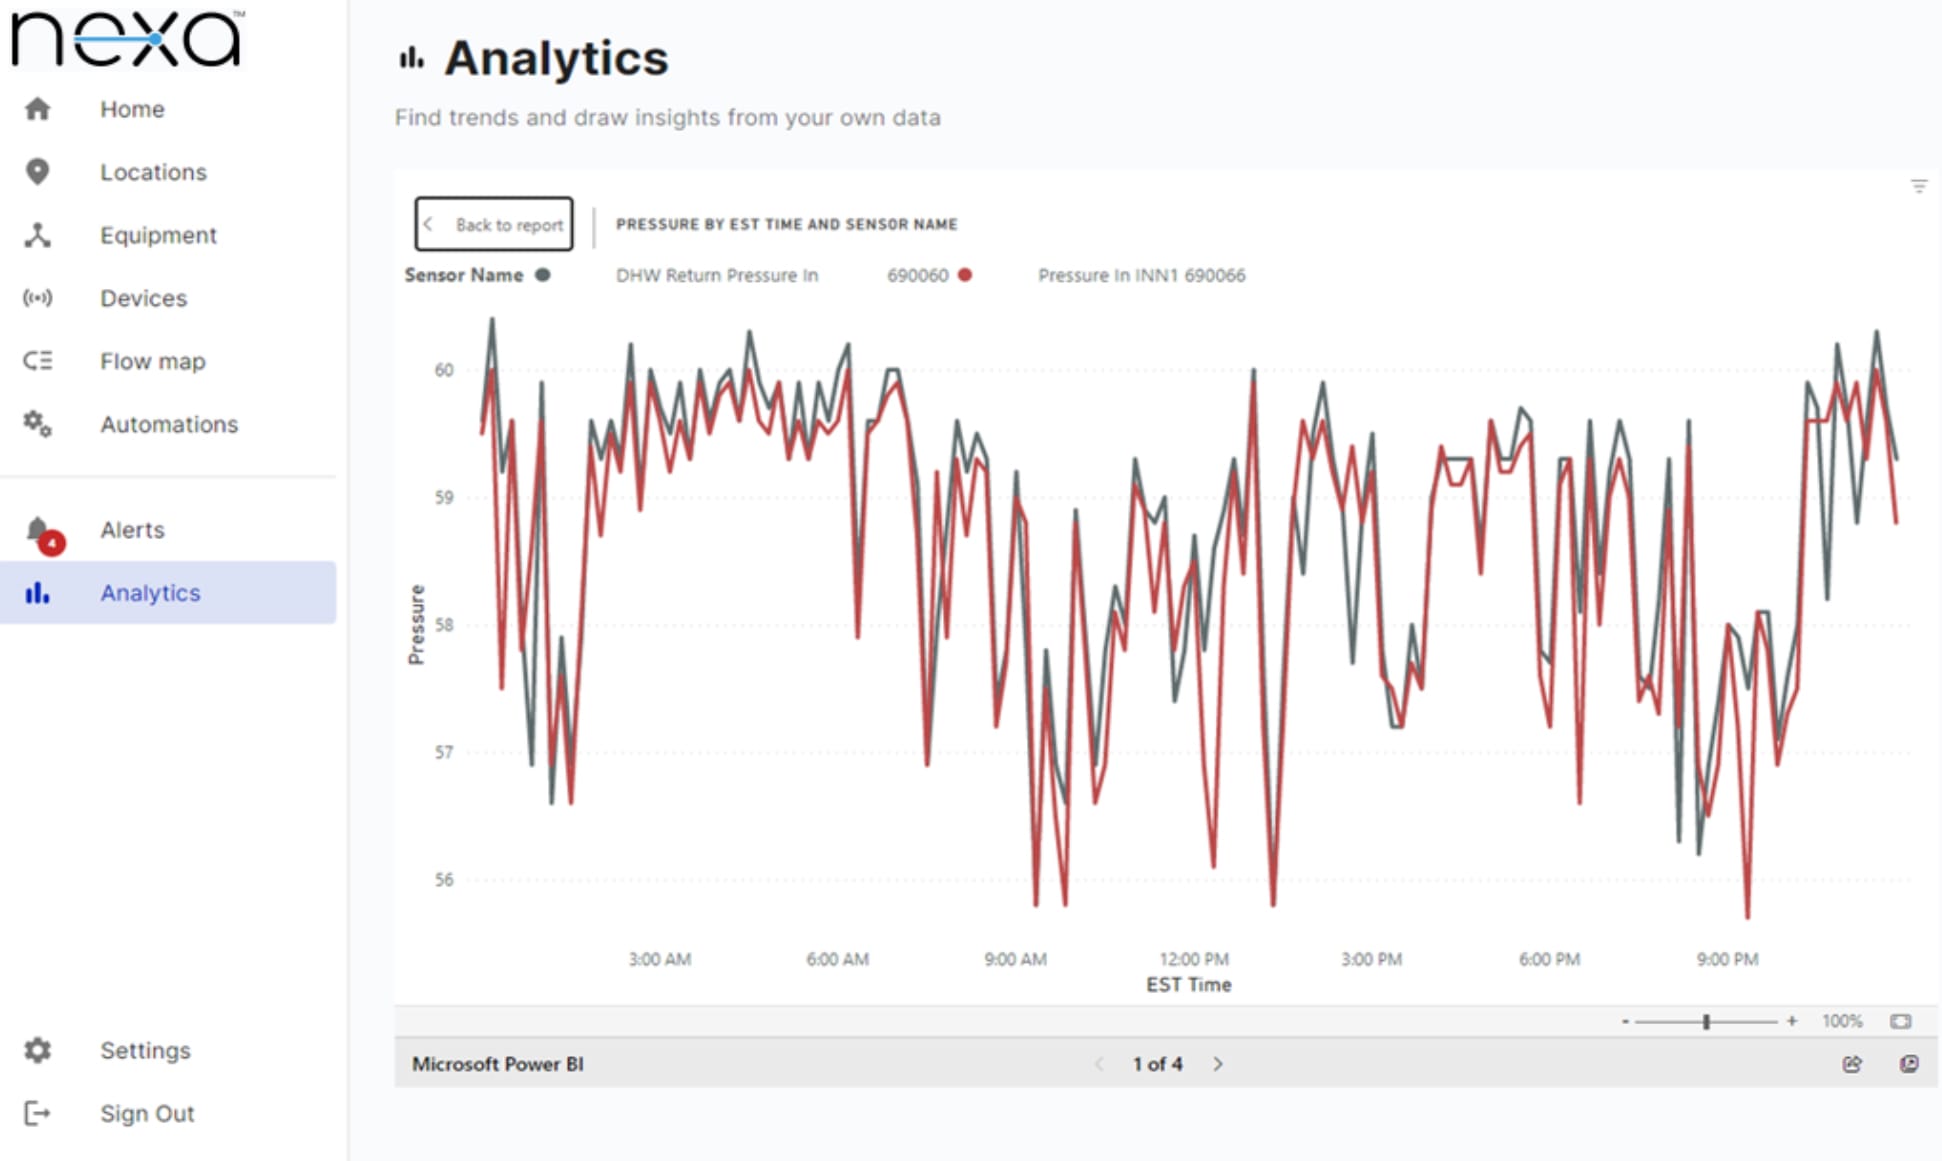
The flow rate was estimated by measuring the pressure rise across a pump and plotting it against the pump curve. The head across pump is estimated on average to be ½ psi or 1.2ft of head. Given the pump curve, it is estimated that on average the flow rate is approximately 30 GPM.
Insights
The Nexa Analytics center showed that the temperature difference across Branch 12 was too wide relative to a baseline, indicating an energy opportunity.
Given the estimated flow rate, it was suspected that the loss in temperature was likely due to cold water flowing into the DHW system points-of-use where mixing occurs, such as shower valves and faucet fittings, rather than a lack of insulation and ambient loss. When the DOE asked when the last time those fittings were serviced or replaced, reply was “they haven’t been in the years that I have been here.” The recommendation was to perform maintenance on each of the guest room fittings along Branch 12: replace check valves, replace seals, and replace fittings as needed.
Action
The DOE and facilities team inspected various shower and faucet fittings and replaced check valves to minimize crossflow of cold water into the DHW system.
Value
Given the age of the property, maintenance schedule, and the retrofitability of Nexa, an energy opportunity was quickly found to yield an immediate ROI within 2 months. On an annual basis, this would save the hotel over $40K.
By monitoring the energy loss at various points in a domestic hot water loop, a user could identify where potential energy saving opportunities could be. The magnitude of the energy saving is based on reducing the loss in temperature to a baseline of 2°F and estimating the flow rate based on the pump used & head pressure, split evenly between the (3) branches.
| Branch 10 | Branch 11 | Branch 12 | |
| Average Temperature Loss | Intermittent | -4°F | -12°F |
| $/mo. @ $9/dekatherm | -$147 | -$601 | -$3,006 |
| $/yr. loss | -$1,759 |
-$7,215 |
-$36,074 |